Buyer guide / operational UI
Next.js dashboard template buying checklist
Evaluate a Next.js dashboard template by operational depth, responsive density, accessibility, data states, architecture, and commercial fit.
- 01
A dashboard is a working environment, so repeated actions and edge states matter more than a beautiful overview screen.
- 02
Test dense data, empty and failure states, keyboard flow, filtering, exports, and narrow widths before buying.
- 03
Separate visual template depth from backend claims: production data and permissions may intentionally remain yours.
The overview screen is the easiest part
Dashboard templates are often sold through one calm analytics view: four metric cards, a smooth line chart, a recent-orders table, and a sidebar. Real operations are less polite. Names wrap, filters combine, exports take time, permissions hide actions, inventories reach zero, searches return nothing, and tables need to remain understandable on a phone used in a warehouse or taxi.
A useful buying test therefore starts after the overview. Open the orders, customers, inventory, analytics, export, and settings routes. Look for repeated interaction patterns and deliberate differences. If every route is the same card grid with different labels, you are buying visual inventory rather than an operational system.
That can still be a valid purchase when you only need a shell. The problem is paying complete-product prices for shell-level depth. Define the boundary: a visual dashboard template should give you credible routes, states, responsive behavior, and source. Your production APIs, permissions, queues, and domain rules remain integration work unless the seller explicitly provides and documents them.
Inspect these states before the happy path
The following states reveal whether the dashboard was designed as a system or assembled as a screenshot set.
- 01
Dense tables
Add long names, multiple statuses, dates, currency, and row actions. Verify column priority, horizontal behavior, and readable alignment.
- 02
Empty results
Clear the data and apply filters with no matches. The screen should explain the state and preserve an obvious next action.
- 03
Loading and failure
Confirm async areas reserve space, communicate progress, expose retry behavior, and do not block unrelated navigation.
- 04
Selection and bulk action
Rows need persistent selection feedback, a clear selected count, safe destructive-action boundaries, and keyboard reachability.
- 05
Filters and search
Filters should show active state, compose predictably, reset in one action, and remain understandable after navigation or refresh.
- 06
Narrow screens
Navigation, primary actions, and critical record identity must remain available. Responsive does not mean shrinking every desktop column.
Shell, surface, or application foundation?
The label “dashboard template” covers three scopes. Price and evaluate the one actually being sold.
| Option | Evidence to expect | Integration remaining | Good fit |
|---|---|---|---|
| Dashboard shell | Navigation, layout, tokens, example cards, and one representative table | Most routes, states, workflows, data, permissions, and domain behavior | Teams that already own the product architecture and need a fast visual frame |
| Operational surface | Multiple connected routes, dense states, filters, exports, settings, and responsive patterns | Production APIs, authentication, persistence, authorization, and business rules | Teams that need a credible internal product and will connect their own backend |
| Application foundation | Operational UI plus documented auth, data model, server behavior, and deployment services | Industry-specific rules, final data, credentials, and organization-specific policy | Teams whose largest risk is full-stack infrastructure rather than visual differentiation |
The operational loop
A dashboard earns trust when every route supports the same loop without changing its visual grammar.
- 01Notice
Metrics, alerts, statuses, and exceptions make the next problem visible without manufacturing urgency.
- 02Inspect
Search, filter, sort, and record detail expose the evidence behind the signal.
- 03Act
Primary, bulk, and destructive actions communicate scope, consequence, progress, and completion.
- 04Verify
Updated status, history, exports, and feedback show that the operation produced the expected result.
ORA demonstrates an operational surface, not a backend claim
The commerce dashboard includes orders, inventory, customers, analytics, exports, settings, and responsive interaction patterns. It is designed for teams connecting their own data and auth.
Inspect the ORA commerce dashboard ↗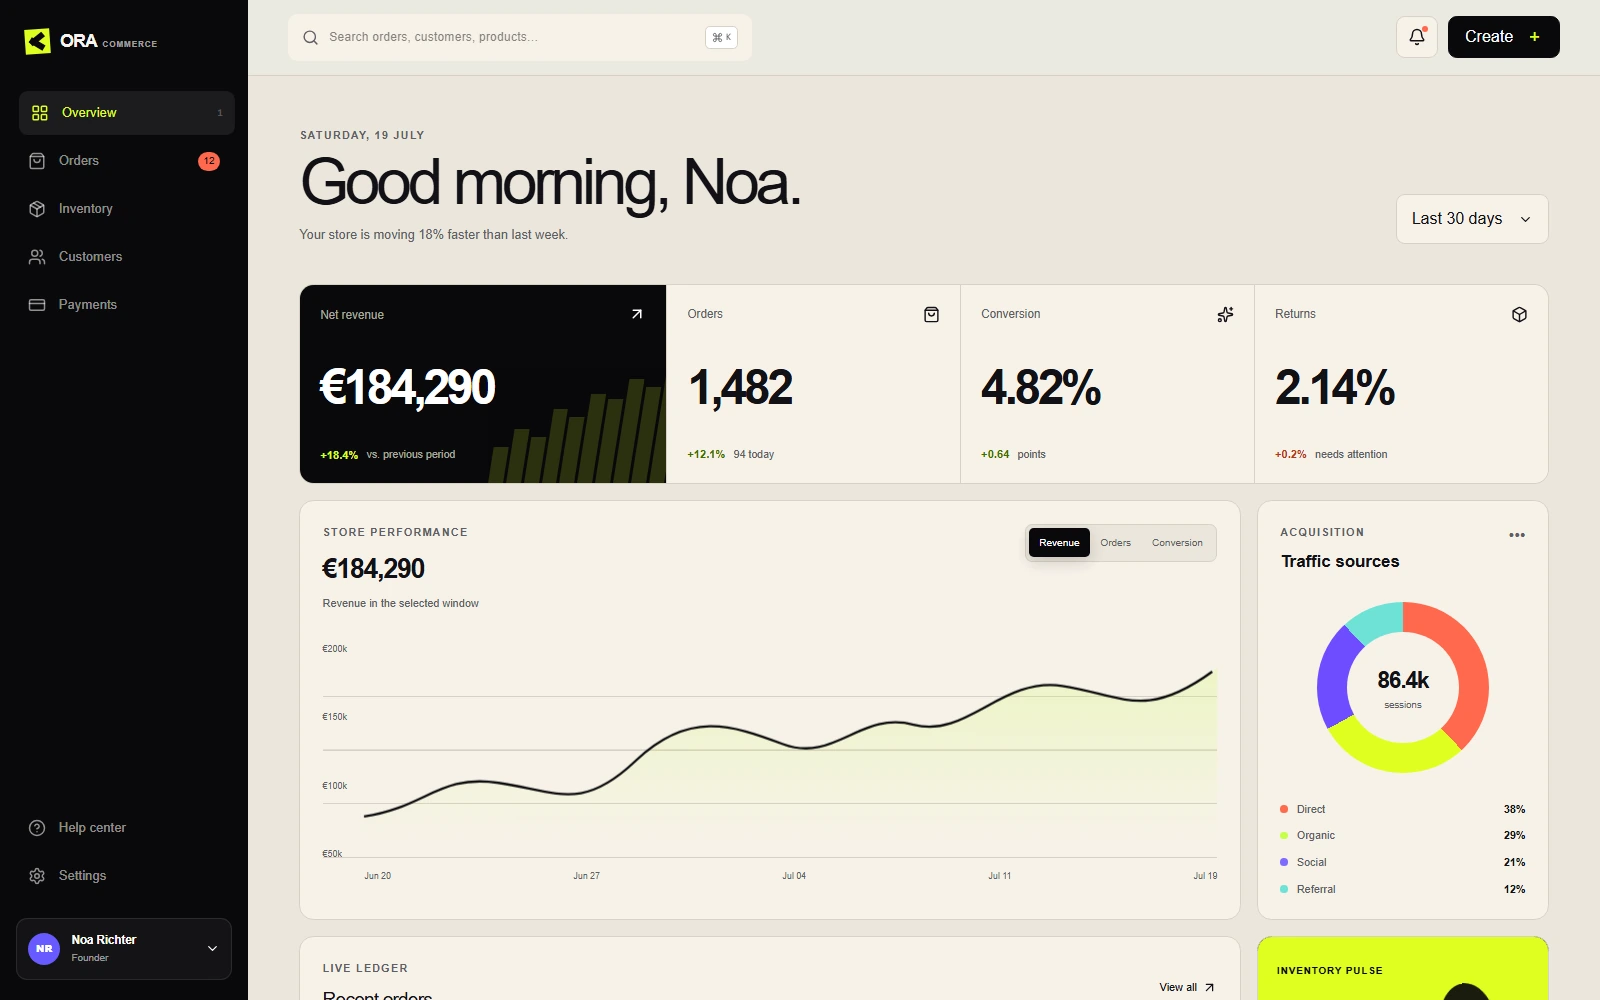
Score adaptation cost, not component quantity
A dashboard with two hundred components can still require more work than one with forty if its navigation, table behavior, tokens, and route hierarchy fight your product. Count the patterns you can preserve unchanged: one filter system reused across routes, one status language, one table density model, one mobile navigation contract, and one way to communicate asynchronous work.
Inspect the code where patterns meet. Does navigation know every page directly, or consume a typed route model? Are table styles coupled to mock data? Can status colors be changed through tokens? Does a card component own spacing that breaks when placed in a dense panel? Clean seams are more valuable than a large folder of variants because your backend integration will pressure those seams immediately.
Finally, give the template one realistic task from your roadmap. Map the record fields, actions, states, and permissions it needs. If you can identify exactly which existing patterns cover that task and which pieces must be built, the template is doing its job. If the answer remains “it looks close,” keep evaluating.